Understanding the Interface
Master the EzuneDB dashboard and navigate efficiently through all the main areas.
Main Dashboard Overview
The main screen is divided into several key areas that work together to provide a seamless data analysis experience:
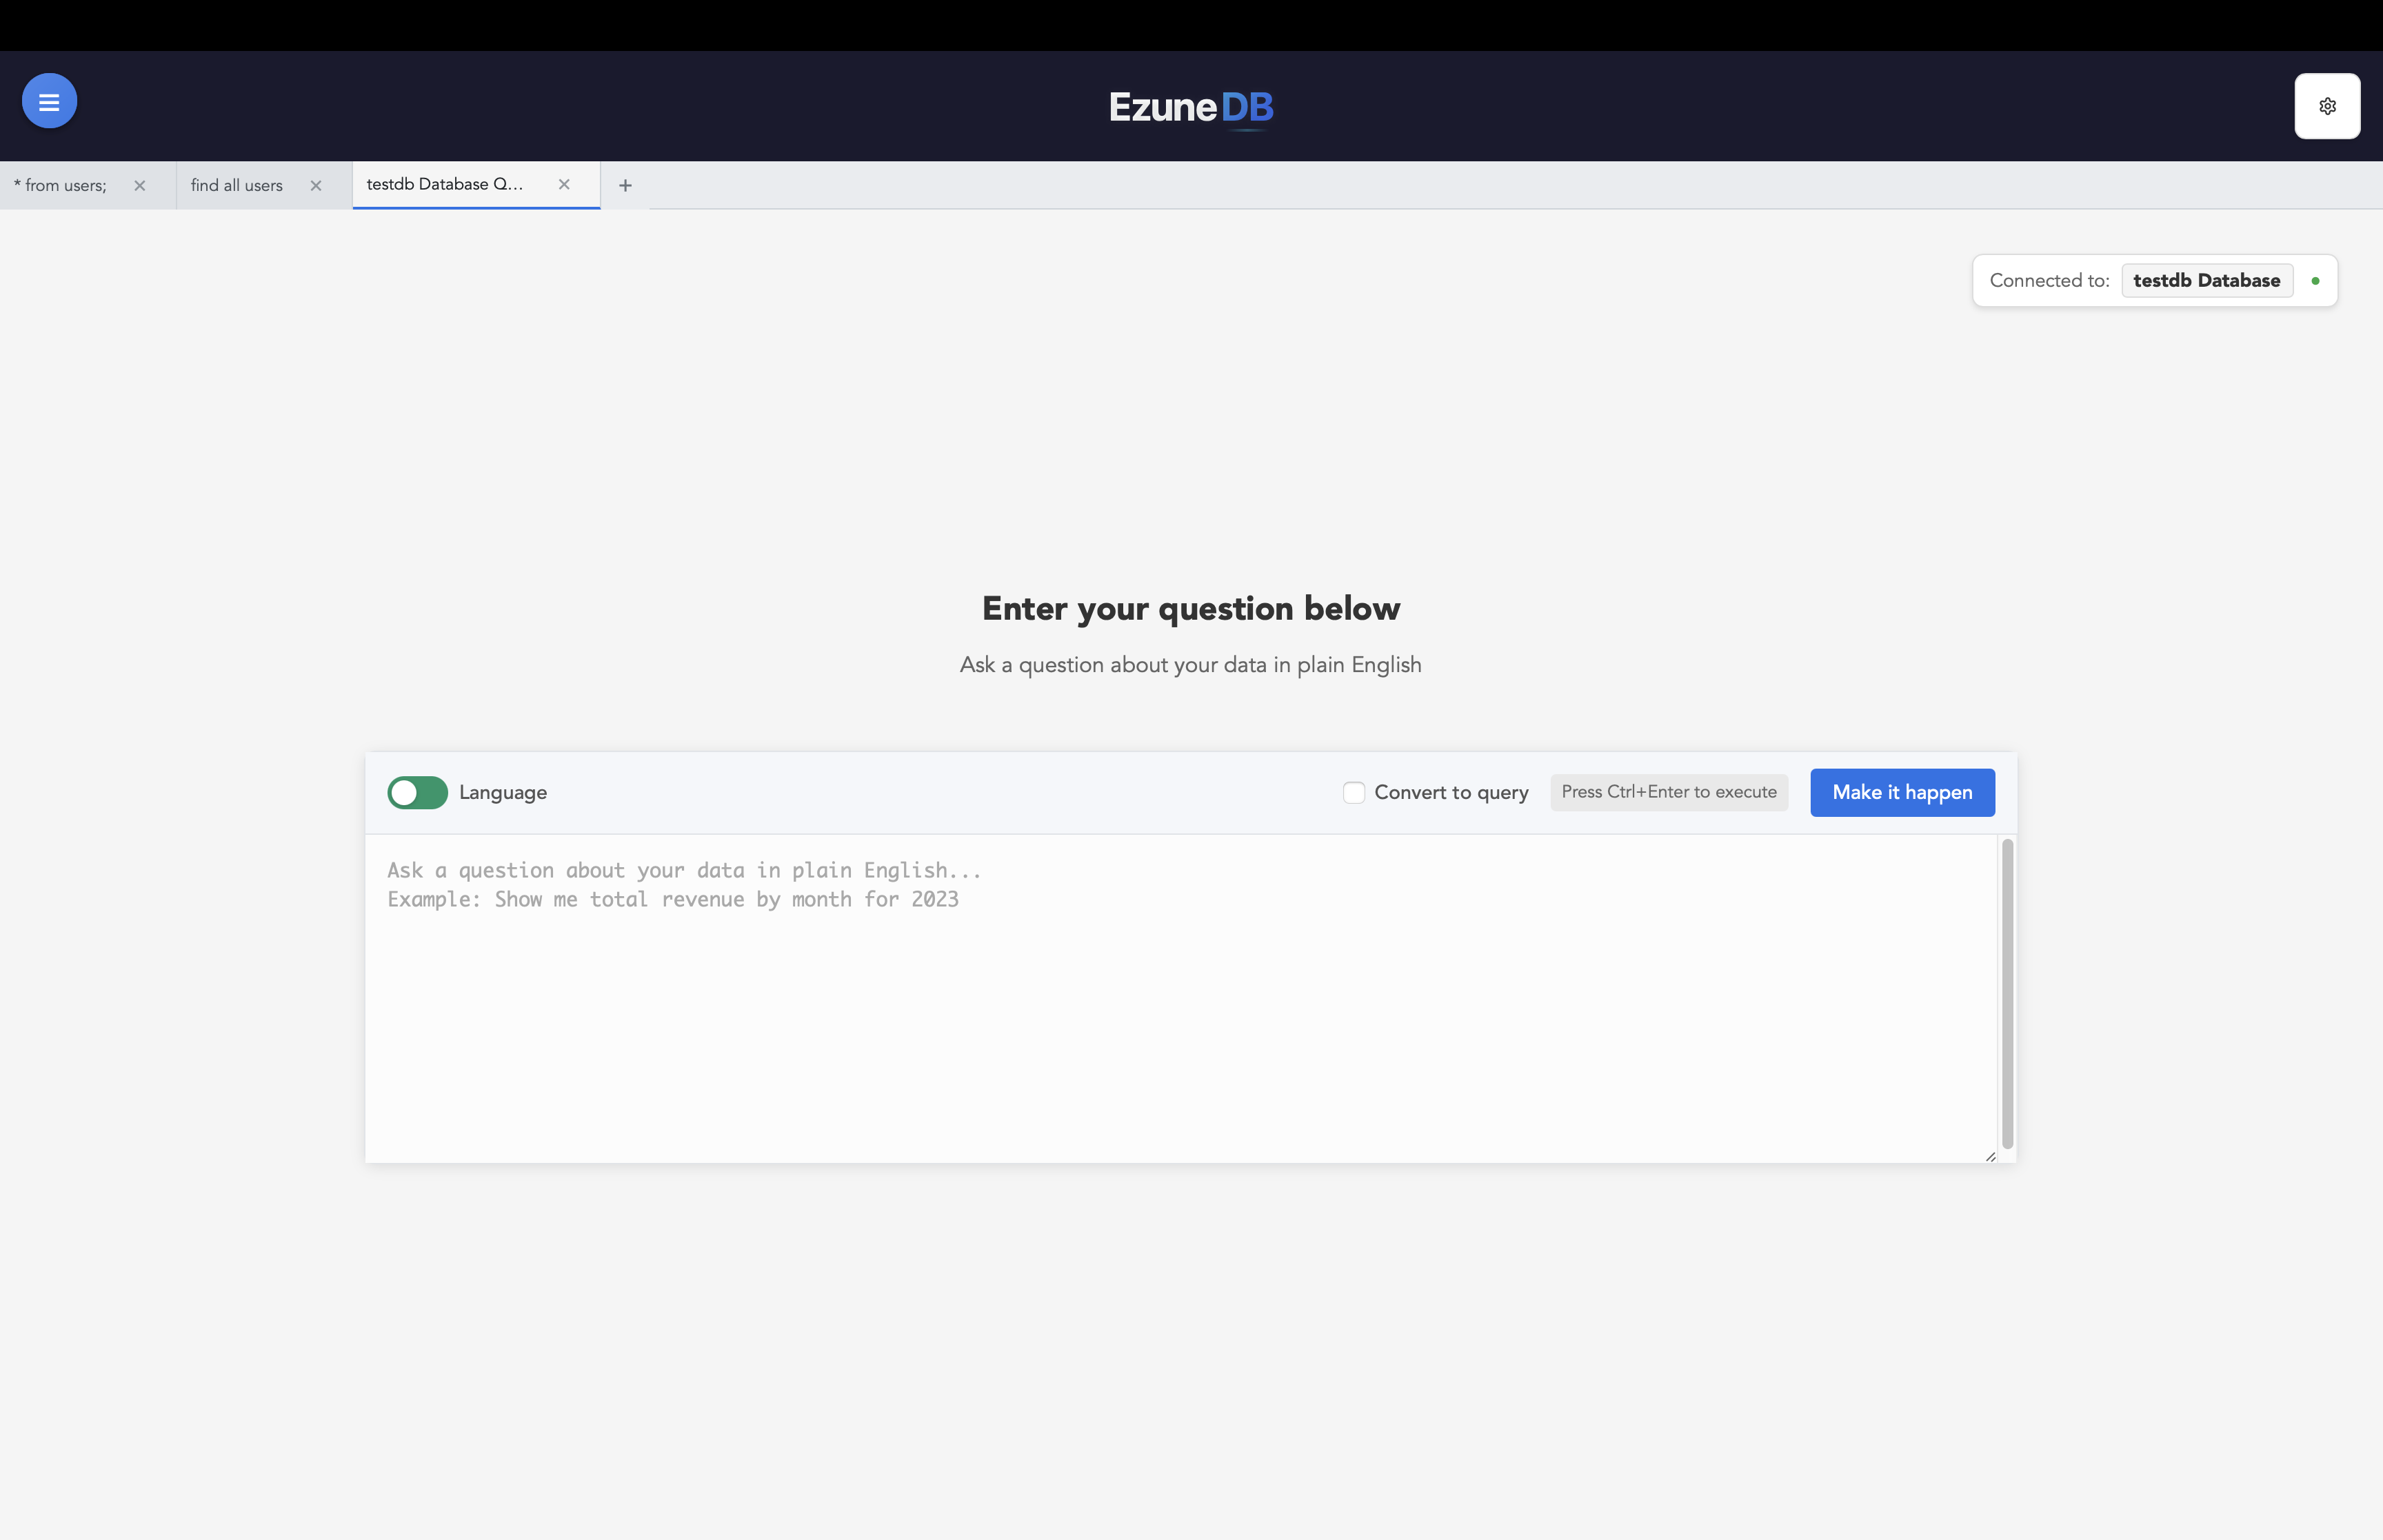
Key Interface Areas:
Sidebar (Left Side)
Database Sources
List of your connected databases and data sources
Add New Source
Button to connect additional databases to your workspace
Refresh
Update your database list and refresh connections
Tab Bar (Top)
Query Tabs
Each tab represents a different query or analysis session
New Tab
Create a new analysis workspace to work on multiple queries
Close Tab
Remove tabs you no longer need to keep workspace organized
Main Content Area
Query Panel
Where you write your questions in natural language or SQL queries
Results Area
Shows your data in tables, charts, and visualizations
Visualization Controls
Customize how your data is displayed and exported
Settings Menu (Top Right)
Account Settings
Manage your subscription, profile, and user preferences
Export Options
Download your data in different formats (CSV, Excel, PDF)
Help and Support
Access documentation, tutorials, and contact support
Pro Tips for Navigation
Keyboard Shortcuts
Space- Toggle query panel open/closedCtrl+C- Copy selected rows to clipboardEscape- Clear row selectionCtrl+Click- Select multiple rows
Efficiency Tips
- • Use multiple tabs for different analyses
- • Pin frequently used database sources
- • Customize your workspace layout
- • Save queries for quick reuse