EzuneDBDocumentation
Everything you need to know about exploring and visualizing your data with EzuneDB
Getting Started
Install EzuneDB, complete first-run setup, and run your first query
Understanding the Interface
Navigate the sidebar, work in tabs, and explore your schema visually
Connecting to Data
Add databases, test connectivity, and manage your sources
Working with Queries
Ask questions in plain English, review the generated SQL, and run it inline
Visualizing Data
Ask for a chart and get an interactive visualization from live data
Data Export
Take results, charts, and whole conversations out of EzuneDB
Quick Reference
Keyboard Shortcuts
Cmd/Ctrl+T- New chat tabCmd/Ctrl+W- Close current tabCmd/Ctrl+Enter- Send message
Need Help?
- Send feedback from Settings
- Contact our support team
Best Practices
- Be specific with your questions
- Use time periods in questions
- Export large results via CSV
See It In Action
Get a quick visual overview of what makes EzuneDB so powerful and easy to use
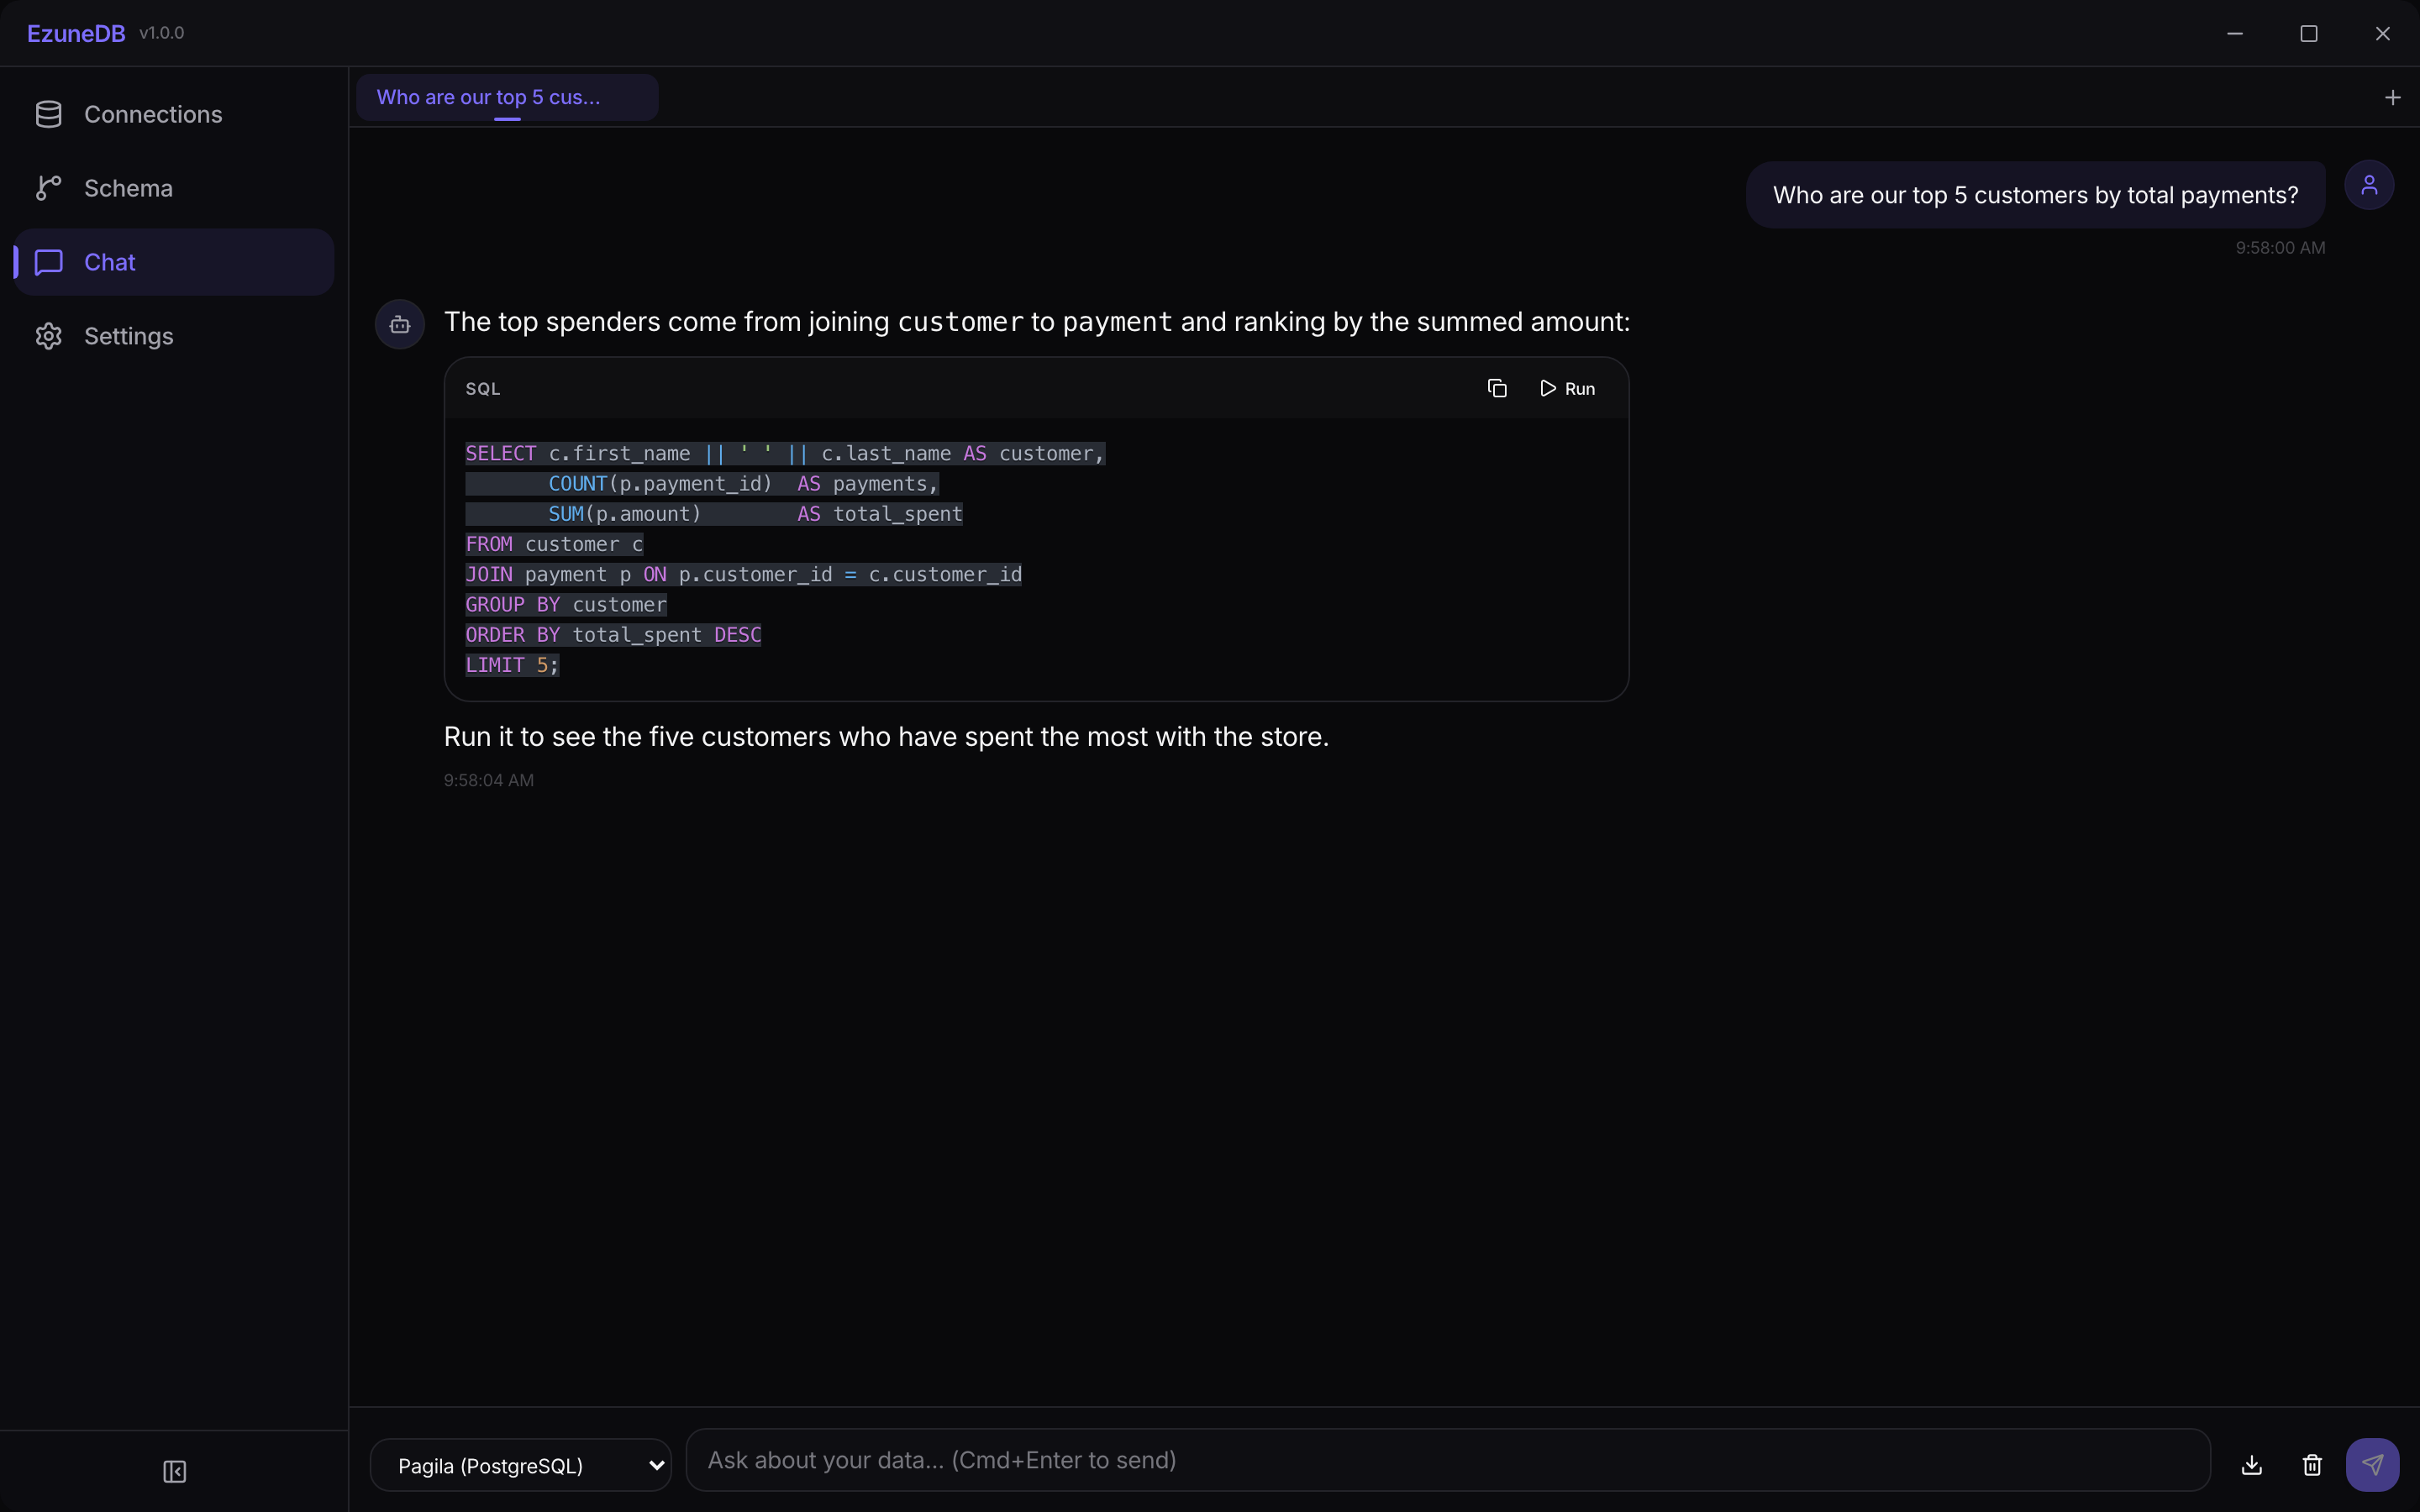
Ask Questions Naturally
No SQL knowledge required. Just ask questions in plain English and get instant, explained SQL.
Learn more about queries →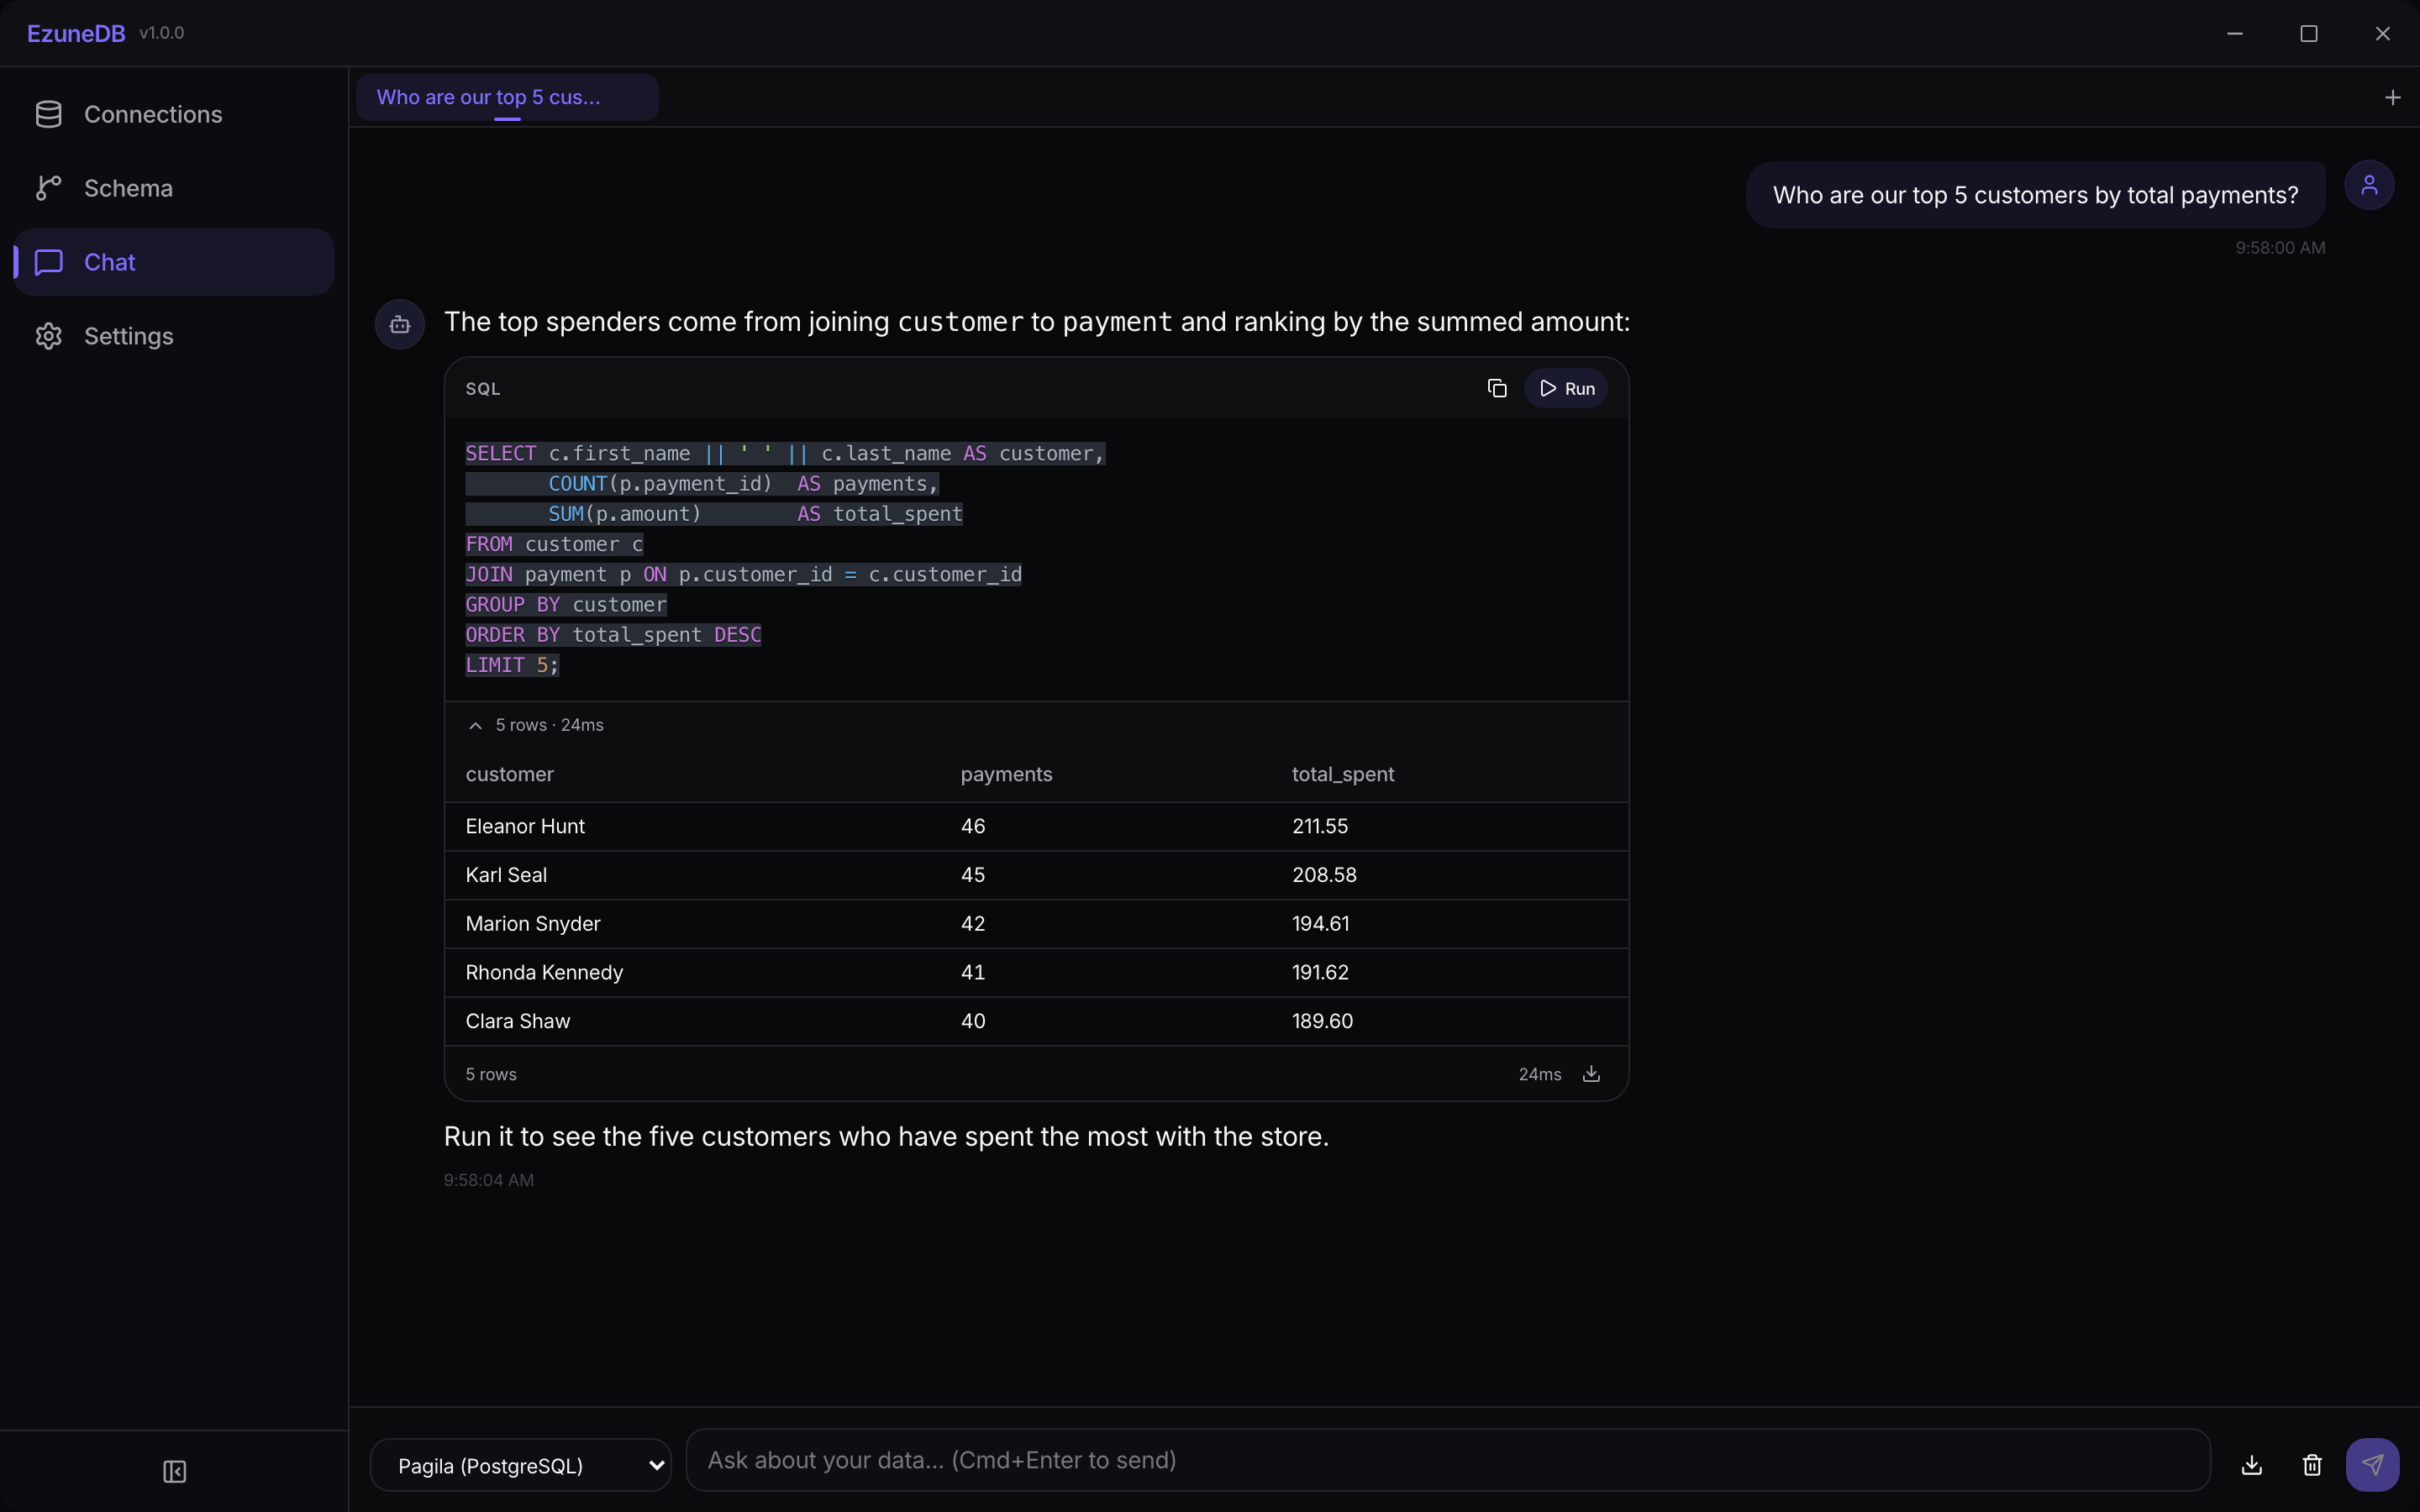
Results Where You Ask
Run the generated SQL with one click and see the rows inline — no window juggling.
Explore the interface →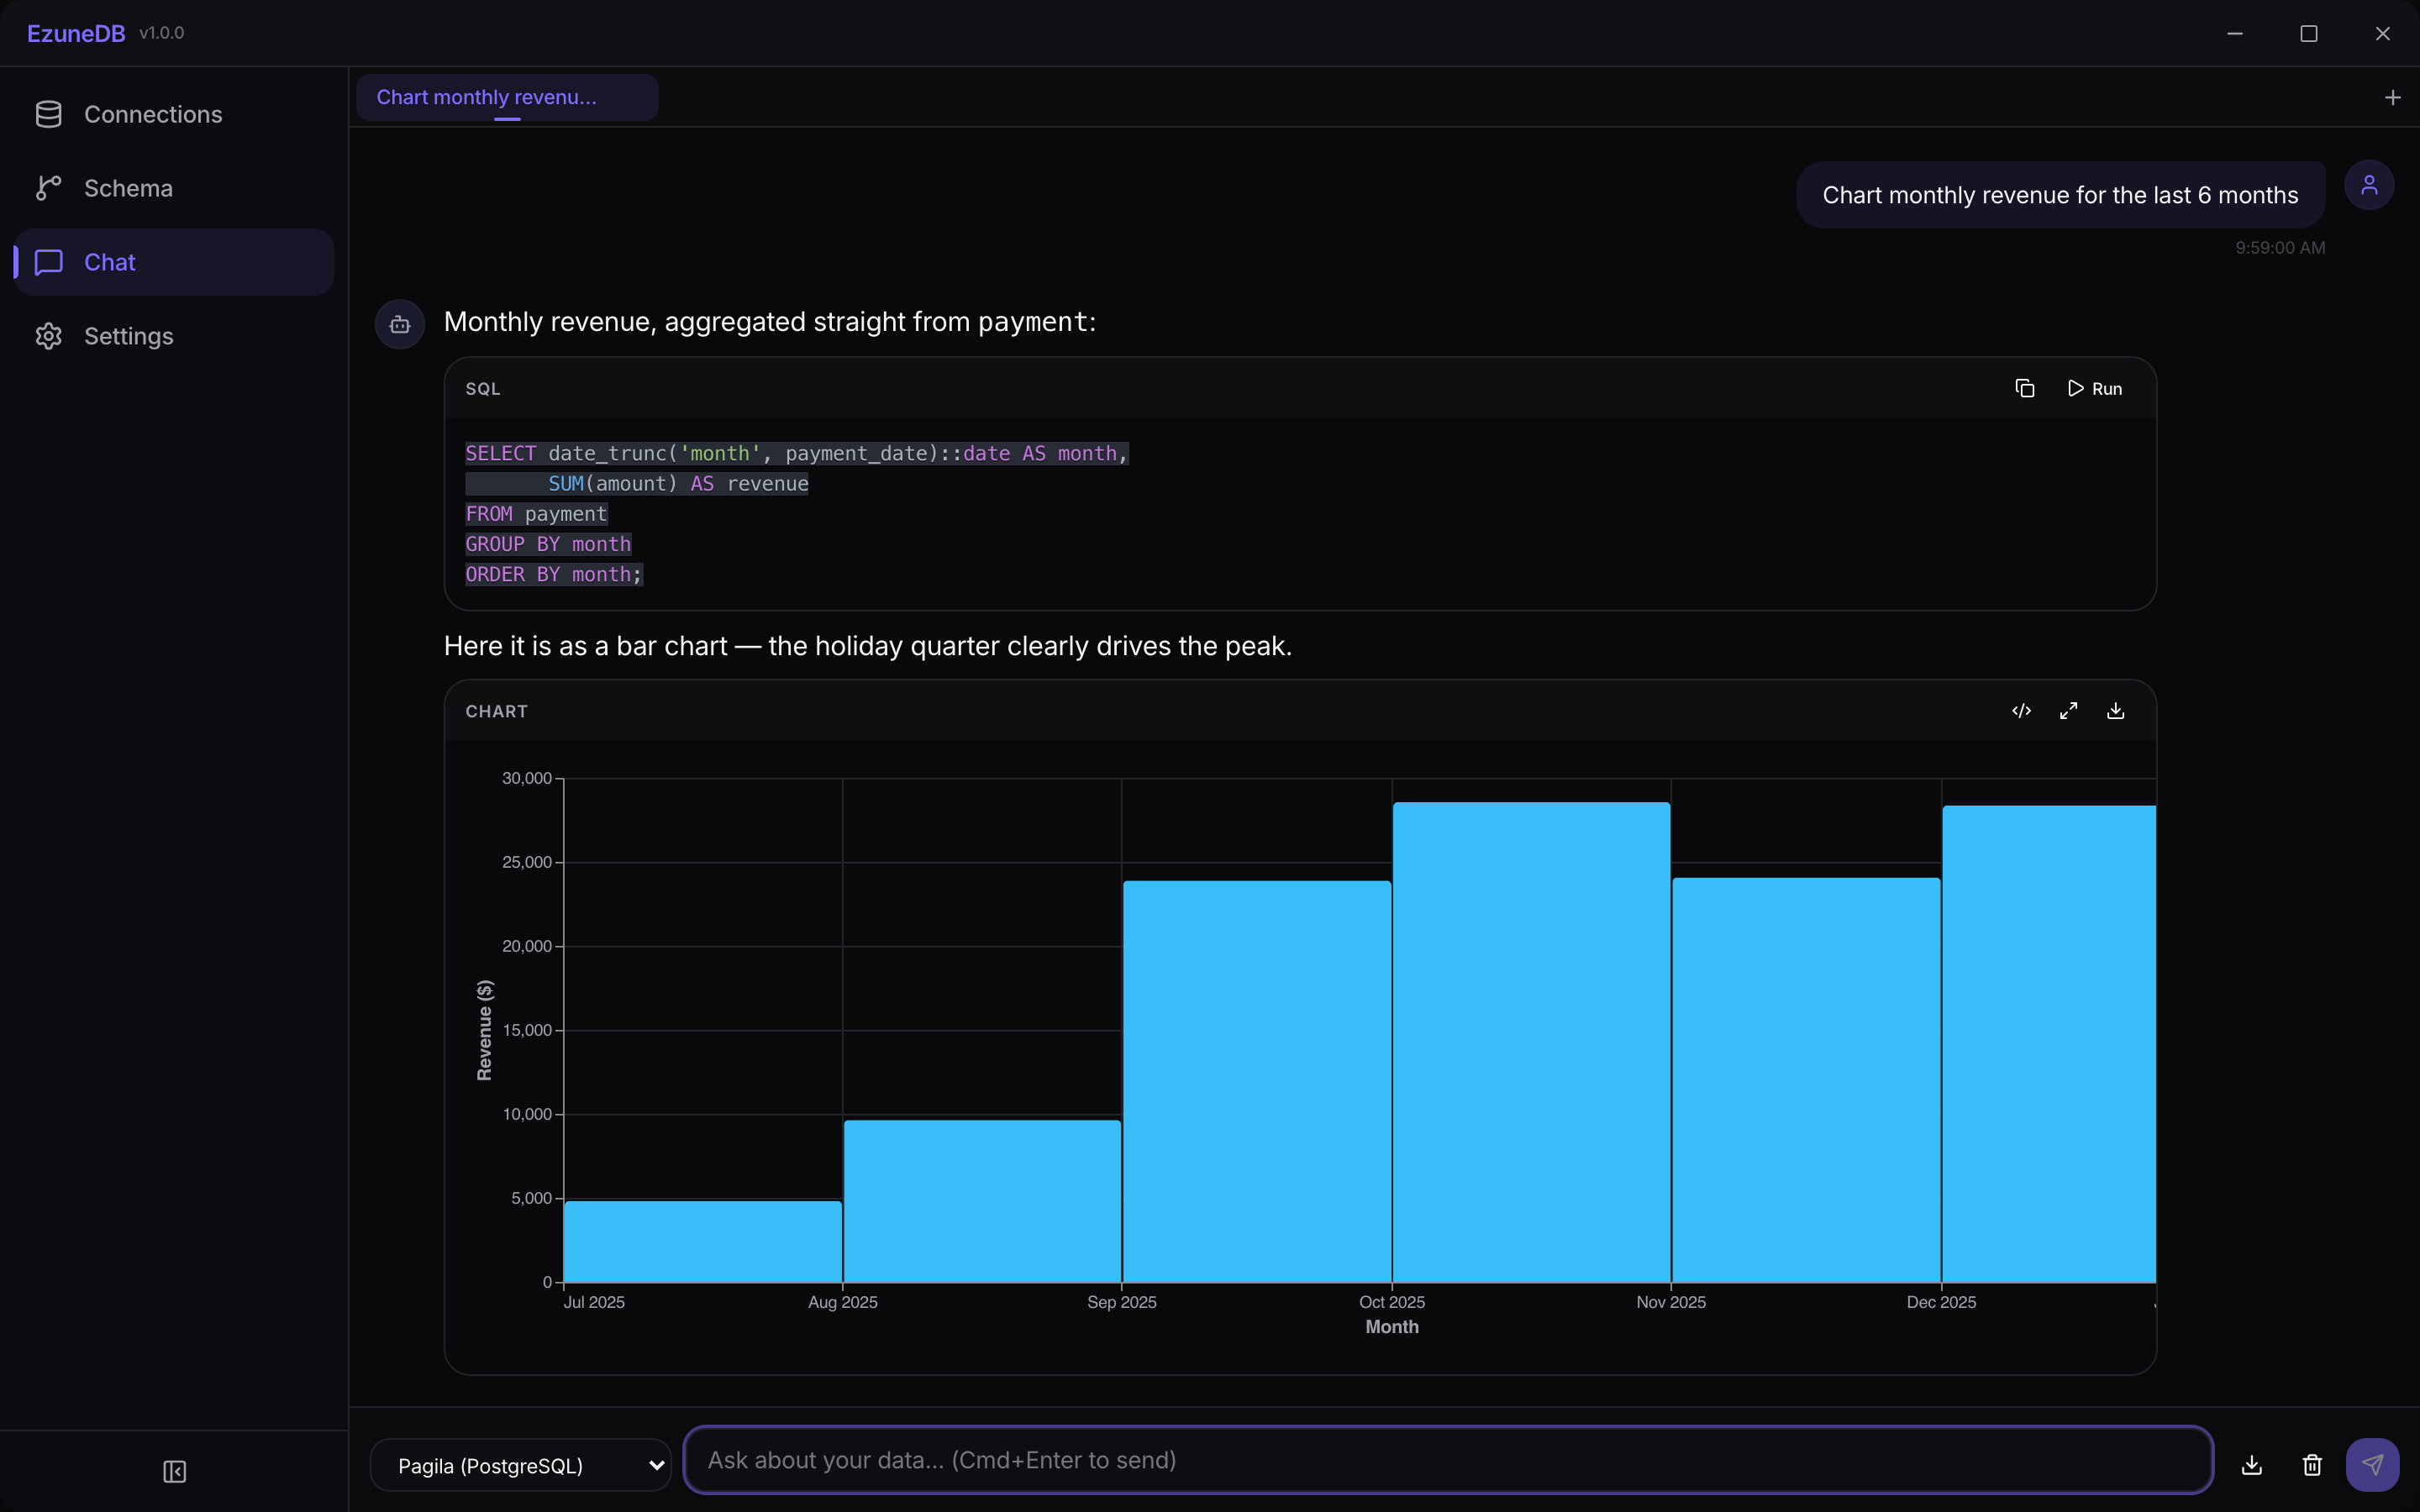
Visual Insights
Ask for a chart and get an interactive visualization built from your live data.
Create visualizations →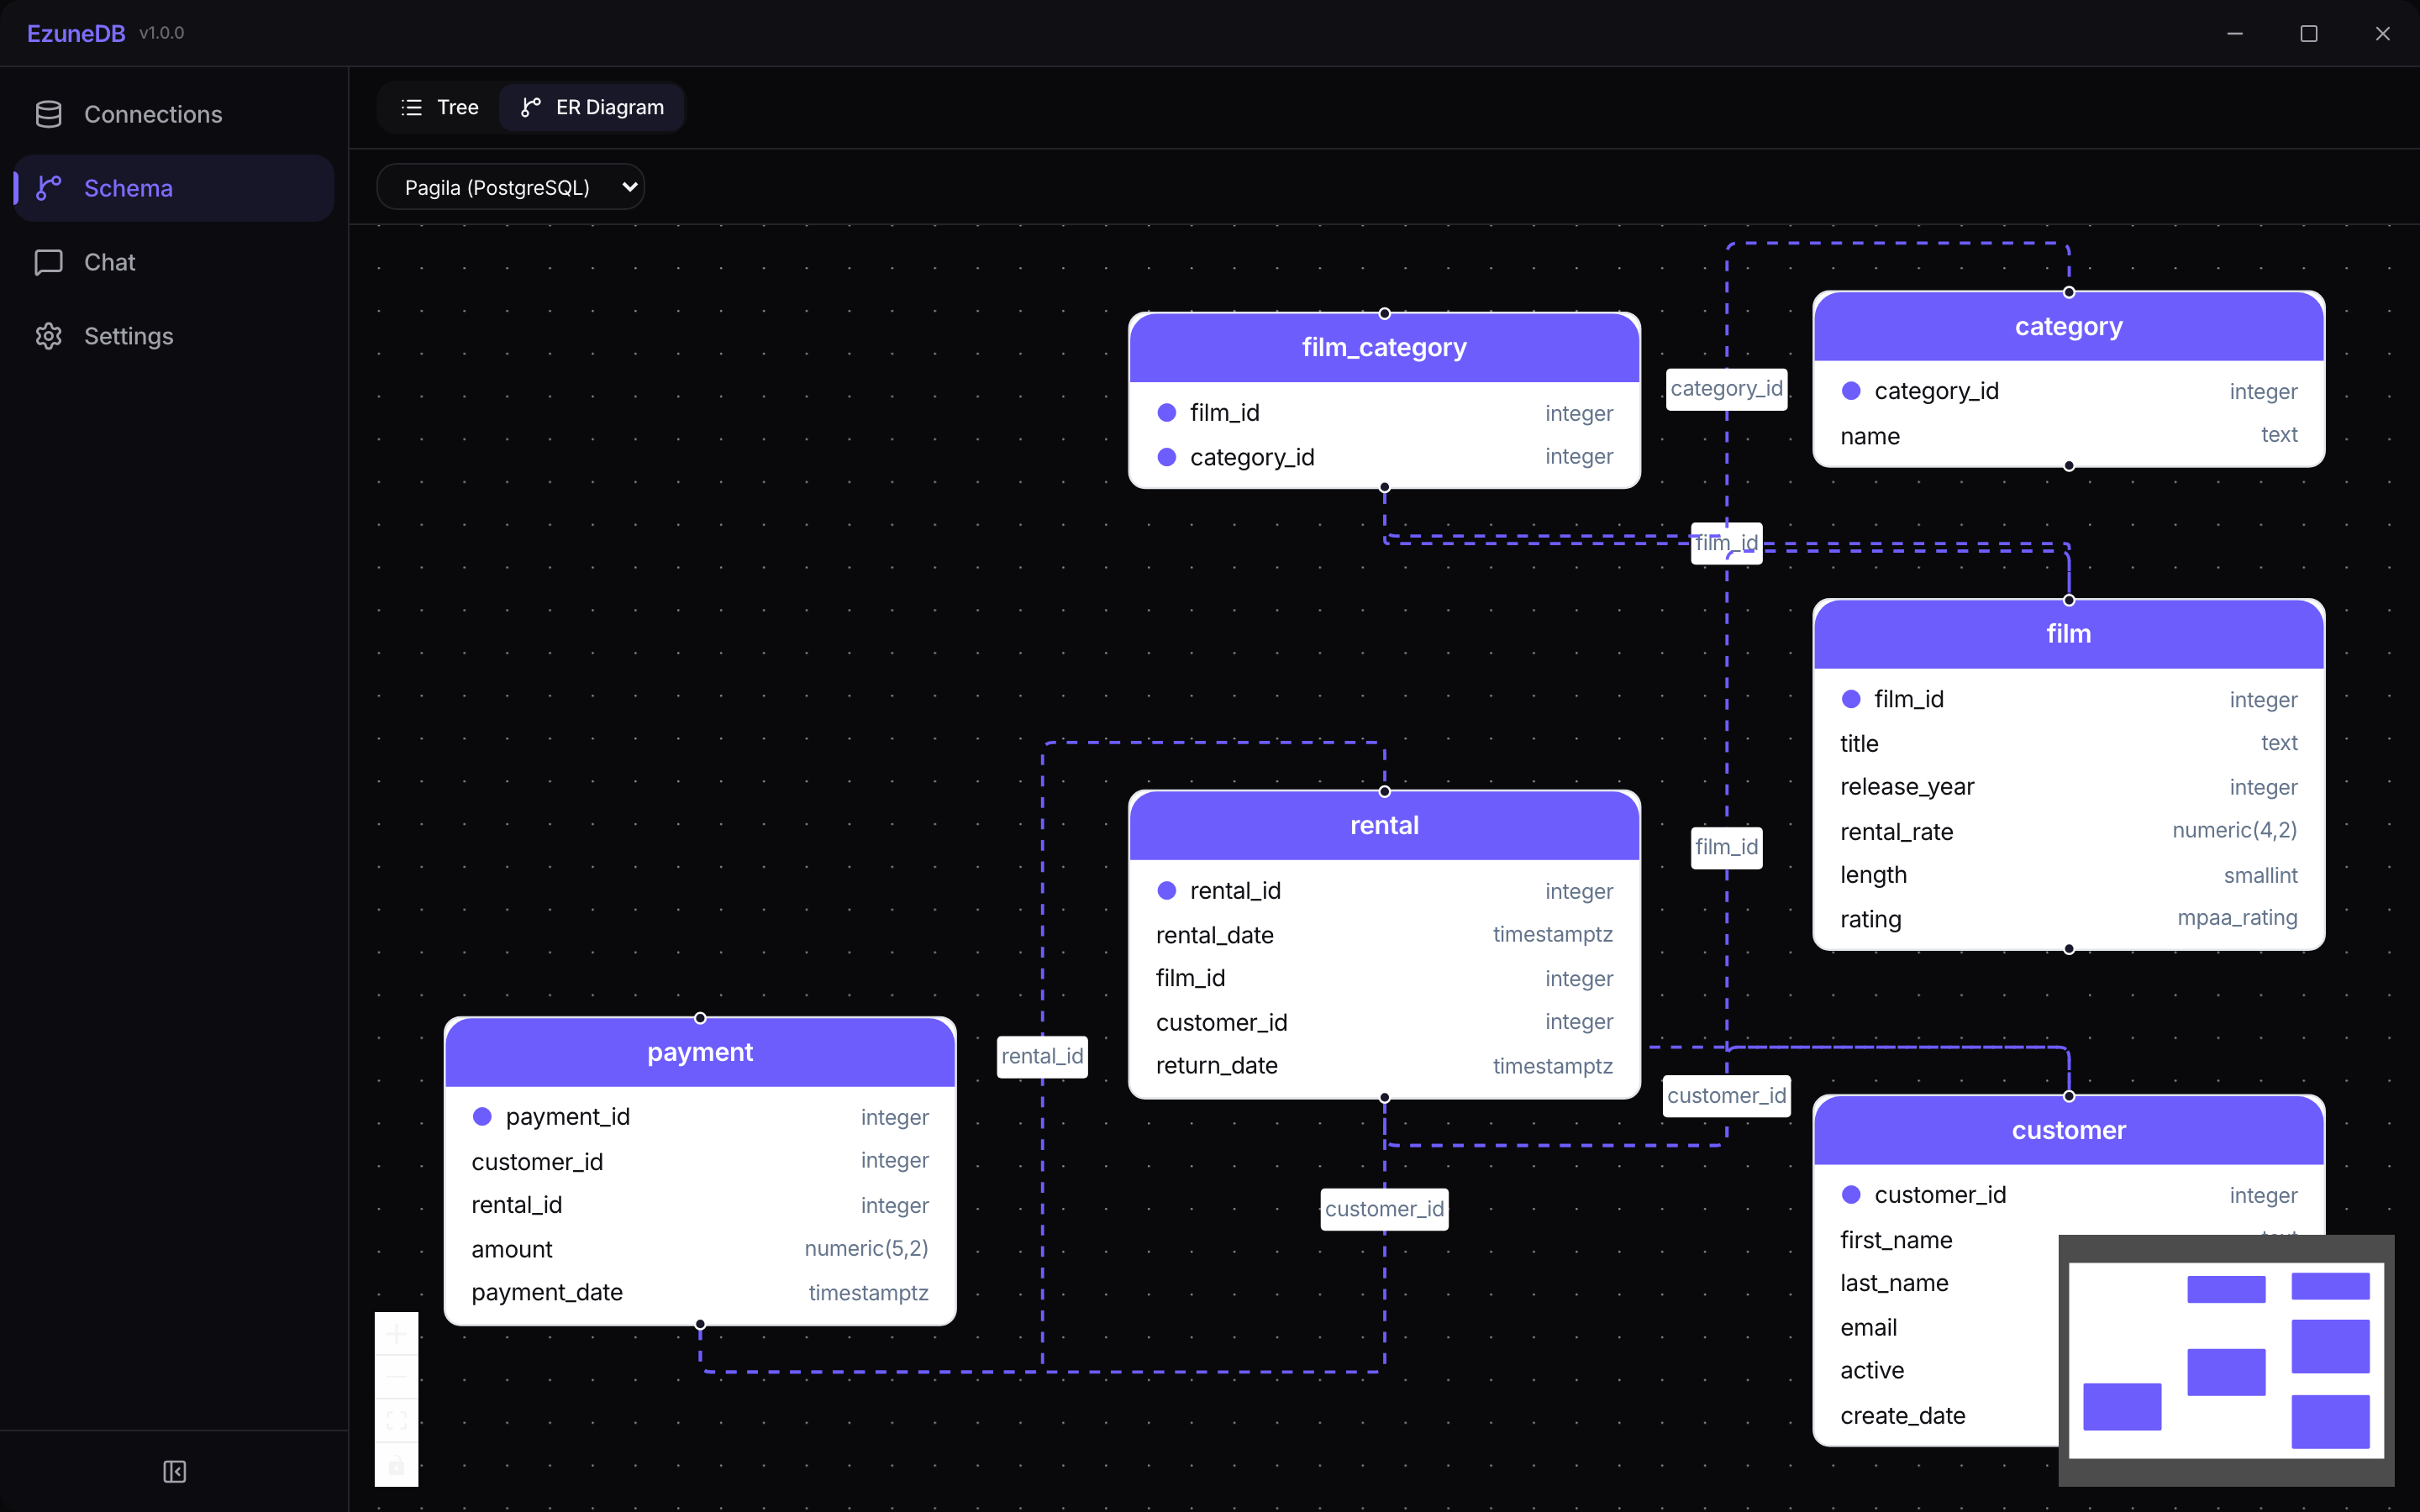
Understand Your Schema
Browse tables as a tree or an interactive ER diagram to see how everything connects.
Explore the schema tools →